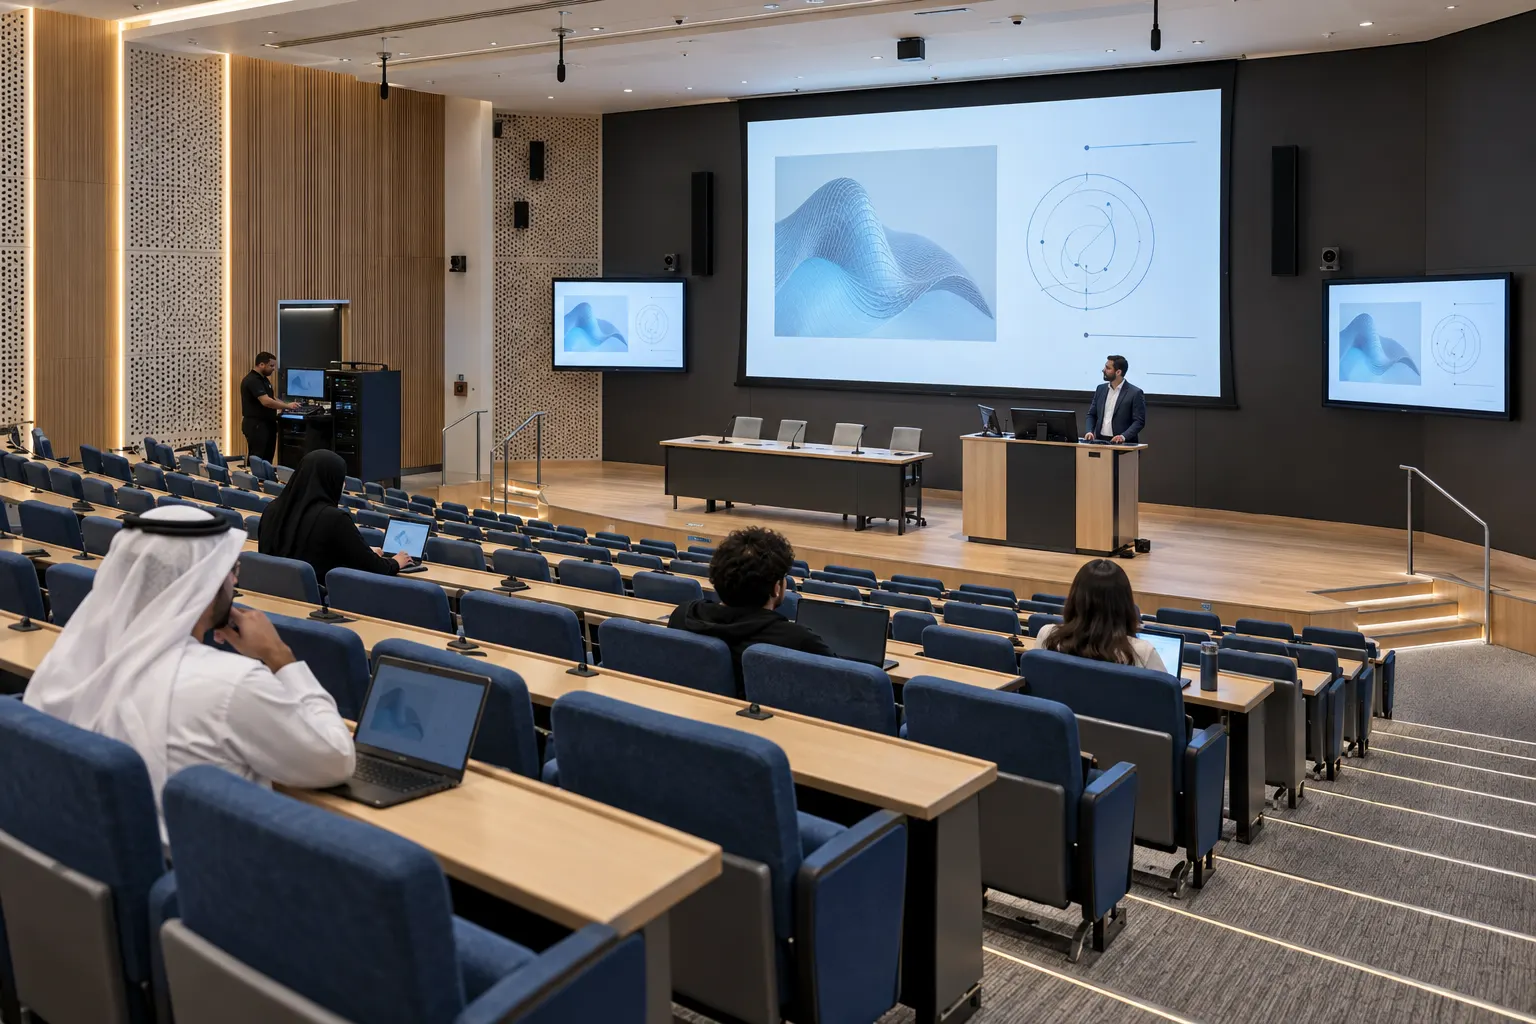
One hall. A clear plan for every event.
- Presentation connections, main display and sightline checks.
- Speech microphones, sound processing, room coverage and stage monitoring.
- Cameras, event recording and streaming in MH-02 and MH-03.
Sound reinforcement, simultaneous interpretation and background sound for a 1,008-seat multi-purpose hall and the teaching and rehearsal spaces around it, designed from an electroacoustic model of the hall.
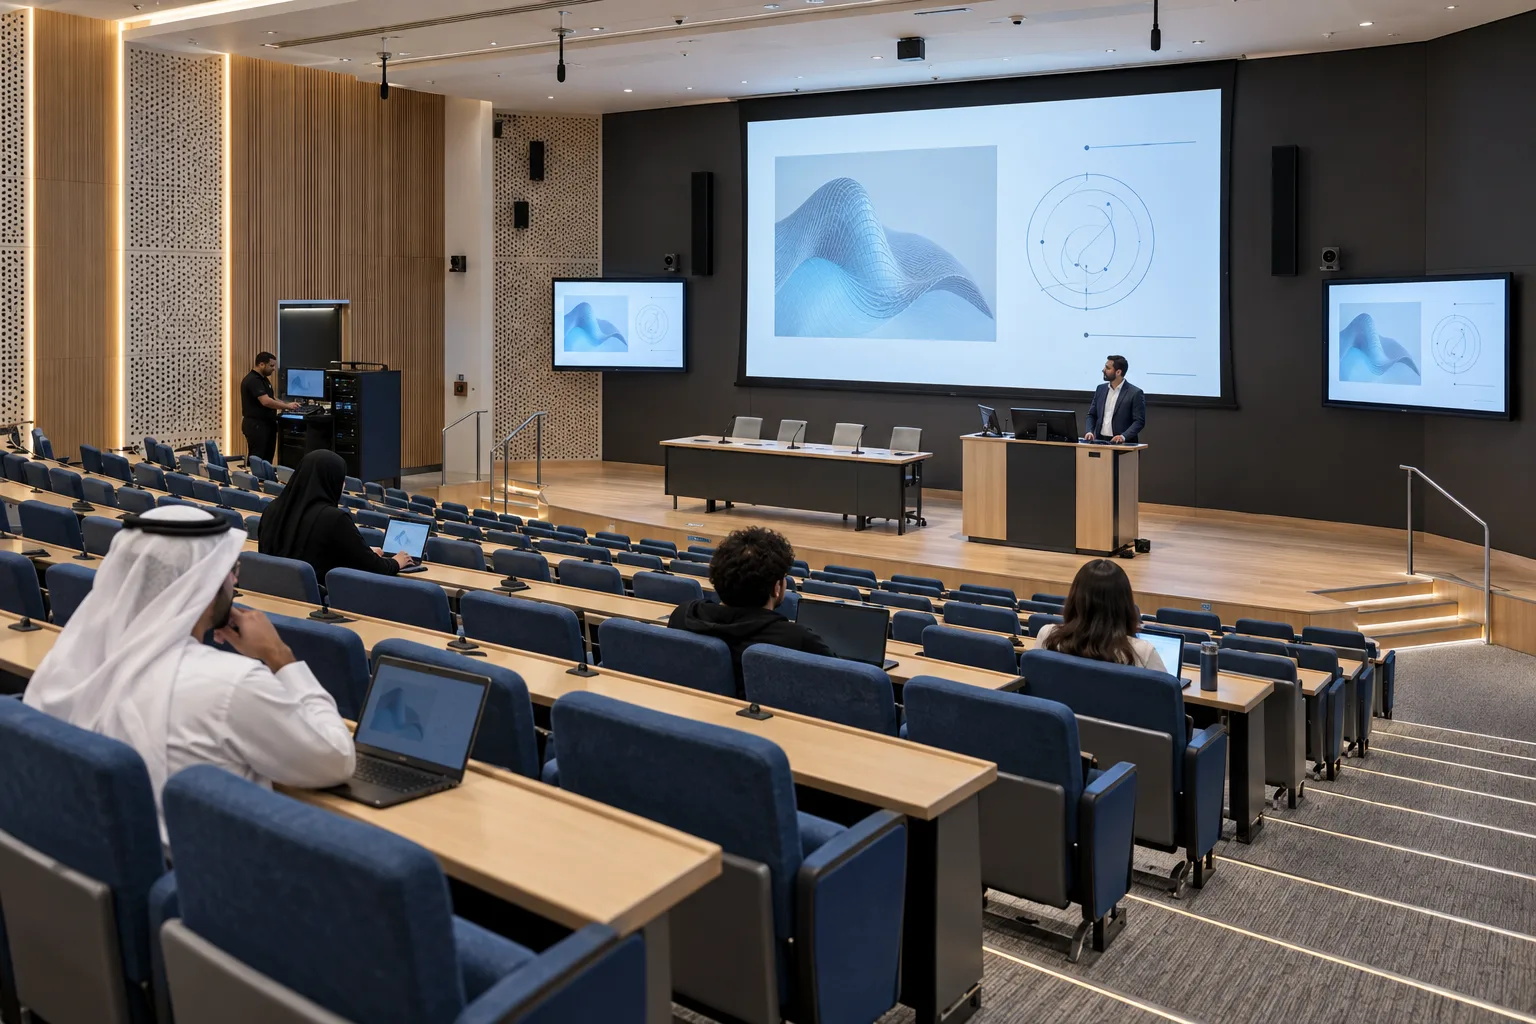 Illustrative visual, not the site
Project experience of our team members.
The hall seats 1,008 and is used for concerts, congresses and campus events. The building around it adds a rehearsal hall, a recording and streaming studio, a creative lab, lecture rooms, choreography halls and public areas with background sound and announcements.
The loudspeaker positions and angles were chosen in an electroacoustic model of the hall before the drawings were issued. The model predicts the direct sound level, its spread over the seating, speech intelligibility and musical clarity for every listening zone; the results are below, as the report gives them.
The working documentation then carries the design into construction: structural schematics, placement plans and sections, rack elevations, a cable schedule, power boards and the requirements handed to the architect, the mechanical and electrical engineers and the fire alarm contractor. Its structural schematics are published below as the team issued them: anonymised, with the labels translated into English.
The documented scope arranged in the four system layers used across every solution.
The simulation report of the hall, redrawn from its figures: direct sound level by frequency band, speech intelligibility and musical clarity over the seating. Values are the report's; where its text and its charts disagree, the charts are shown.
Point at a zone, or move to it with the keyboard, to read its values.
| Zone | Back | Middle | Front |
|---|---|---|---|
| Stalls, left block | 104.3 | 102.0 | 102.7 |
| Stalls, right block | 104.7 | 102.3 | 102.5 |
| Stalls, rear centre | 105.8 | — | 104.9 |
| Centre strip | 106.0 | — | 105.9 |
| Raked centre block | 99.7 | 102.3 | 105.0 |
| Left side wing | 99.2 | 101.5 | 103.9 |
| Right side wing | 99.3 | 101.7 | 104.2 |
| Zone | Back | Middle | Front |
|---|---|---|---|
| Stalls, left block | 102.6 | 100.7 | 101.4 |
| Stalls, right block | 102.8 | 102.1 | 101.4 |
| Stalls, rear centre | 102.6 | 102.2 | 102.3 |
| Centre strip | 105.0 | — | 104.1 |
| Raked centre block | 98.7 | 100.9 | 104.8 |
| Left side wing | 97.8 | 100.5 | 102.9 |
| Right side wing | 97.9 | 100.8 | 103.2 |
| Zone | Back | Middle | Front |
|---|---|---|---|
| Stalls, left block | 103.9 | 102.8 | 100.4 |
| Stalls, right block | 103.8 | 103.3 | 100.4 |
| Stalls, rear centre | 103.1 | — | 103.0 |
| Centre strip | 99.7 | — | 101.5 |
| Raked centre block | 98.4 | 102.2 | 100.0 |
| Left side wing | 97.5 | 101.5 | 99.2 |
| Right side wing | 97.8 | 101.5 | 99.4 |
| Zone | Back | Middle | Front |
|---|---|---|---|
| Stalls, left block | 103.4 | 106.0 | 103.7 |
| Stalls, right block | 103.4 | 106.1 | 103.2 |
| Stalls, rear centre | 104.2 | 104.3 | 104.0 |
| Centre strip | 104.5 | — | 104.1 |
| Raked centre block | 102.0 | 105.5 | 104.5 |
| Left side wing | 99.8 | 102.7 | 100.7 |
| Right side wing | 100.2 | 103.1 | 101.2 |
| Zone | Back | Middle | Front |
|---|---|---|---|
| Stalls, left block | 106.1 | 107.5 | 104.9 |
| Stalls, right block | 107.1 | 107.5 | 104.1 |
| Stalls, rear centre | 106.1 | — | 107.2 |
| Centre strip | 106.0 | — | 107.1 |
| Raked centre block | 104.5 | 104.9 | 105.8 |
| Left side wing | 104.2 | 104.7 | 104.2 |
| Right side wing | 104.4 | 104.9 | 104.6 |
| Zone | Back | Middle | Front |
|---|---|---|---|
| Stalls, left block | 0.64 | 0.66 | 0.62 |
| Stalls, right block | 0.64 | 0.66 | 0.61 |
| Stalls, rear centre | 0.64 | — | 0.65 |
| Centre strip | 0.65 | — | 0.65 |
| Raked centre block | 0.60 | 0.62 | 0.64 |
| Left side wing | 0.59 | 0.62 | 0.61 |
| Right side wing | 0.59 | 0.62 | 0.62 |
| Zone | Back | Middle | Front |
|---|---|---|---|
| Stalls, left block | 8.1 | 7.1 | 8.8 |
| Stalls, right block | 7.9 | 7.0 | 8.9 |
| Stalls, rear centre | 7.8 | — | 7.8 |
| Centre strip | 7.8 | — | 7.8 |
| Raked centre block | 9.4 | 8.1 | 7.9 |
| Left side wing | 9.8 | 8.9 | 8.9 |
| Right side wing | 9.6 | 8.7 | 8.6 |
Quietest to loudest seatMean ± one standard deviationMeanTarget: 96 dB or more
Seating averageLowest to highest seatRecommended for music, 0 to +6 dB
| Quantity | Mean | Lowest seat | Highest seat | Spread | Std. deviation |
|---|---|---|---|---|---|
| Direct sound level, 250 Hz band | 102.68 dB | 98.70 dB | 106.25 dB | 7.55 dB | 1.99 dB |
| Direct sound level, 500 Hz band | 101.36 dB | 96.85 dB | 105.08 dB | 8.23 dB | 2.09 dB |
| Direct sound level, 1 kHz band | 101.16 dB | 97.07 dB | 104.33 dB | 7.26 dB | 1.86 dB |
| Direct sound level, 2 kHz band | 103.05 dB | 99.13 dB | 106.40 dB | 7.27 dB | 1.69 dB |
| Direct sound level, 4 kHz band | 105.33 dB | 102.65 dB | 109.30 dB | 6.65 dB | 1.13 dB |
| Speech transmission index | 0.625 | 0.579 | 0.664 | 0.085 | 0.016 |
| Articulation loss of consonants | 8.45 % | 6.93 % | 9.95 % | 3.02 % | 0.58 % |
| Clarity C80, 250 Hz band | 2.23 dB | −0.71 dB | 4.47 dB | 5.18 dB | 0.97 dB |
| Clarity C80, 500 Hz band | 3.31 dB | 0.02 dB | 5.98 dB | 5.96 dB | 1.17 dB |
| Clarity C80, 1 kHz band | 3.34 dB | −0.28 dB | 5.57 dB | 5.85 dB | 1.13 dB |
| Clarity C80, 2 kHz band | 2.79 dB | −0.48 dB | 5.34 dB | 5.82 dB | 1.20 dB |
| Clarity C80, 4 kHz band | 3.51 dB | −0.16 dB | 6.20 dB | 6.36 dB | 0.94 dB |
The splay between the elements of each flown array sets where each one points. The top elements reach the rear rows, the lowest ones the front of the stalls; the aim points trace the section of the seating.
| Element | Splay | Aim below frame | Aim point | Horizontal pattern | Rigging safety factor |
|---|---|---|---|---|---|
| Frame | — | — | — | — | 21.3 |
| 1 | 0° | 0° | — | 90° | 23.4 |
| 2 | 2° | 2° | 27.2 m | 90° | 26.1 |
| 3 | 2° | 4° | 24.9 m | 90° | 27.8 |
| 4 | 2° | 6° | 22.9 m | 90° | 30.2 |
| 5 | 2° | 8° | 21.2 m | 90° | 33.5 |
| 6 | 3° | 11° | 19.2 m | 90° | 37.6 |
| 7 | 4° | 15° | 17.7 m | 90° | 45.1 |
| 8 | 4° | 19° | 14.4 m | 90° | 56.1 |
| 9 | 5° | 24° | 12.6 m | 90° | 73.7 |
| 10 | 8° | 32° | 9.3 m | 105° (60° + 45°) | 109.8 |
| 11 | 10° | 42° | 7.2 m | 105° (60° + 45°) | 196.3 |
| 12 | 12° | 54° | 5.8 m | 105° (60° + 45°) | 540.7 |
| Element | Splay | Aim below frame | Aim point | Horizontal pattern | Rigging safety factor |
|---|---|---|---|---|---|
| Frame | — | — | — | — | 51.1 |
| 1 | 0° | 0° | — | Subwoofer | 81 |
| 2 | 5° | 5° | 23.5 m | Subwoofer | 100.4 |
| 3 | 5° | 10° | 19.4 m | Subwoofer | 151 |
| 4 | 5° | 15° | 16.2 m | Subwoofer | 328.7 |
The structural schematic of the hall as the team issued it: each device with its tag and connectors, each cable with the number it carries in the cable schedule. Names, makes and places are removed and the labels translated into English; the engineering is as drawn.
All 9 sheets of the project, PDF (303 KB)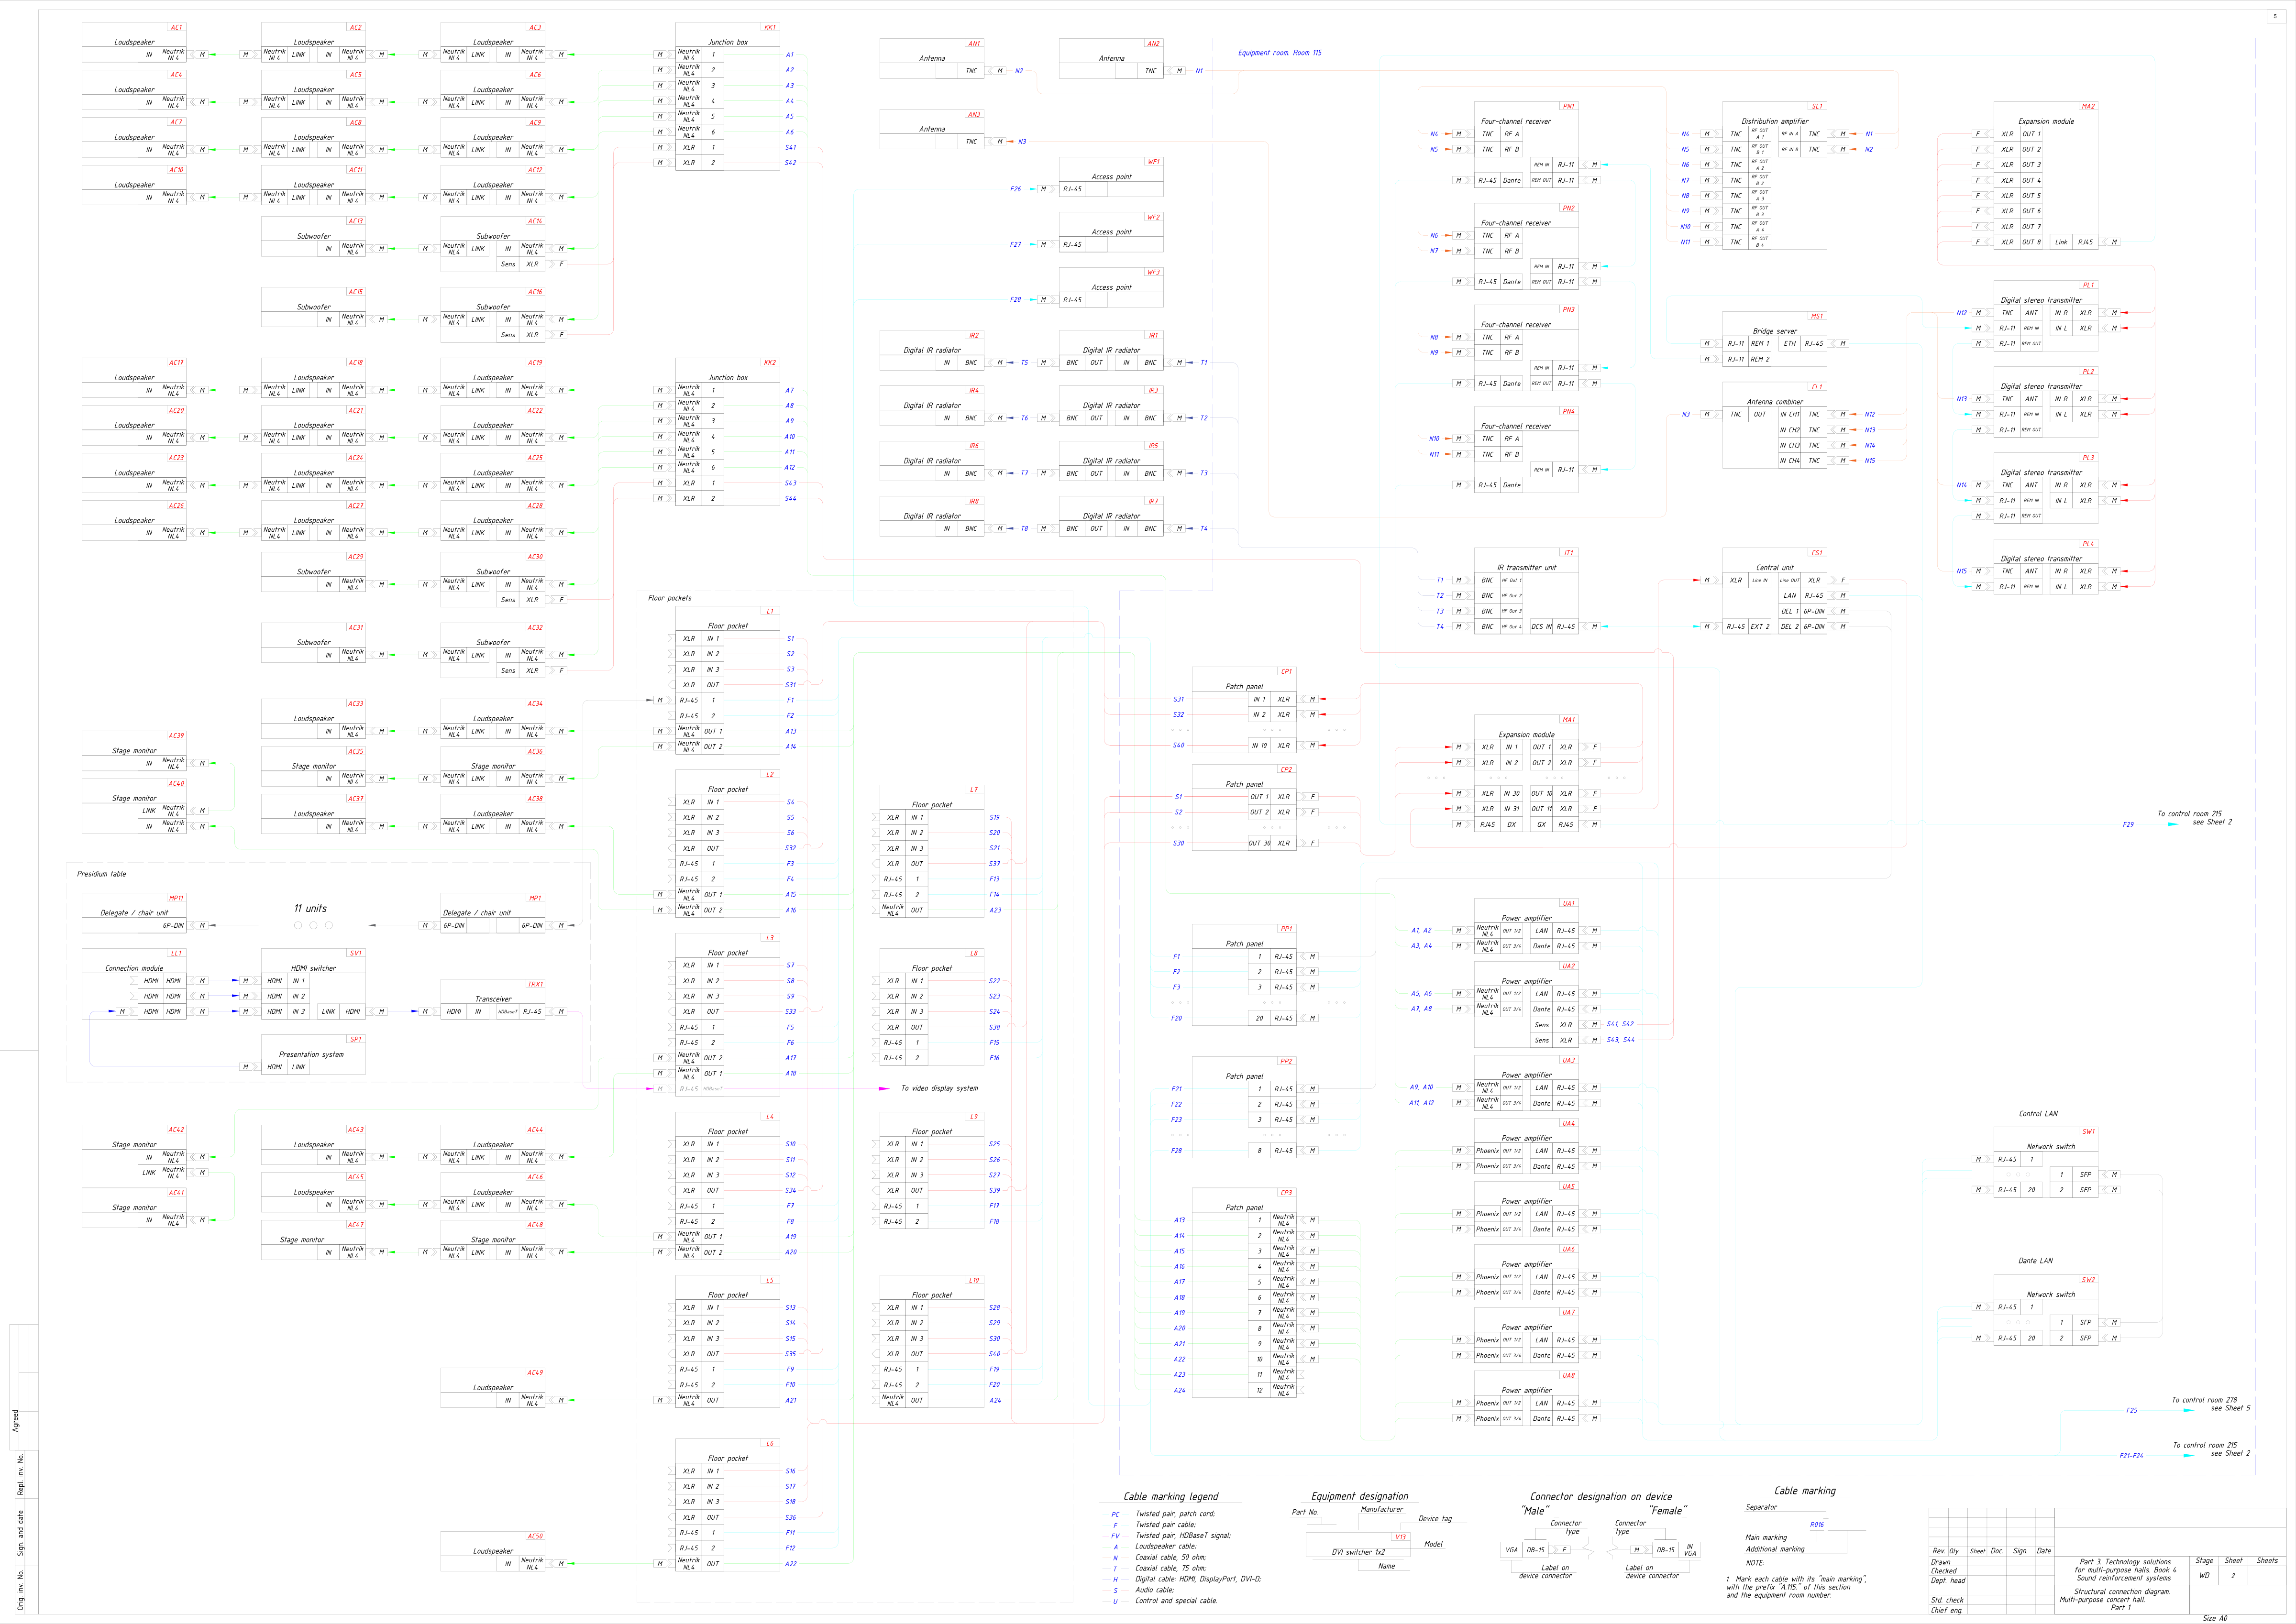
One hall. A clear plan for every event.
Share your room, operational requirements and intended use. Let’s explore an appropriate AV scope.